Minimum OPS+ 125 (25% above league average). Derived from data in stathead.com via baseball-reference.com. Glossary below.
 |
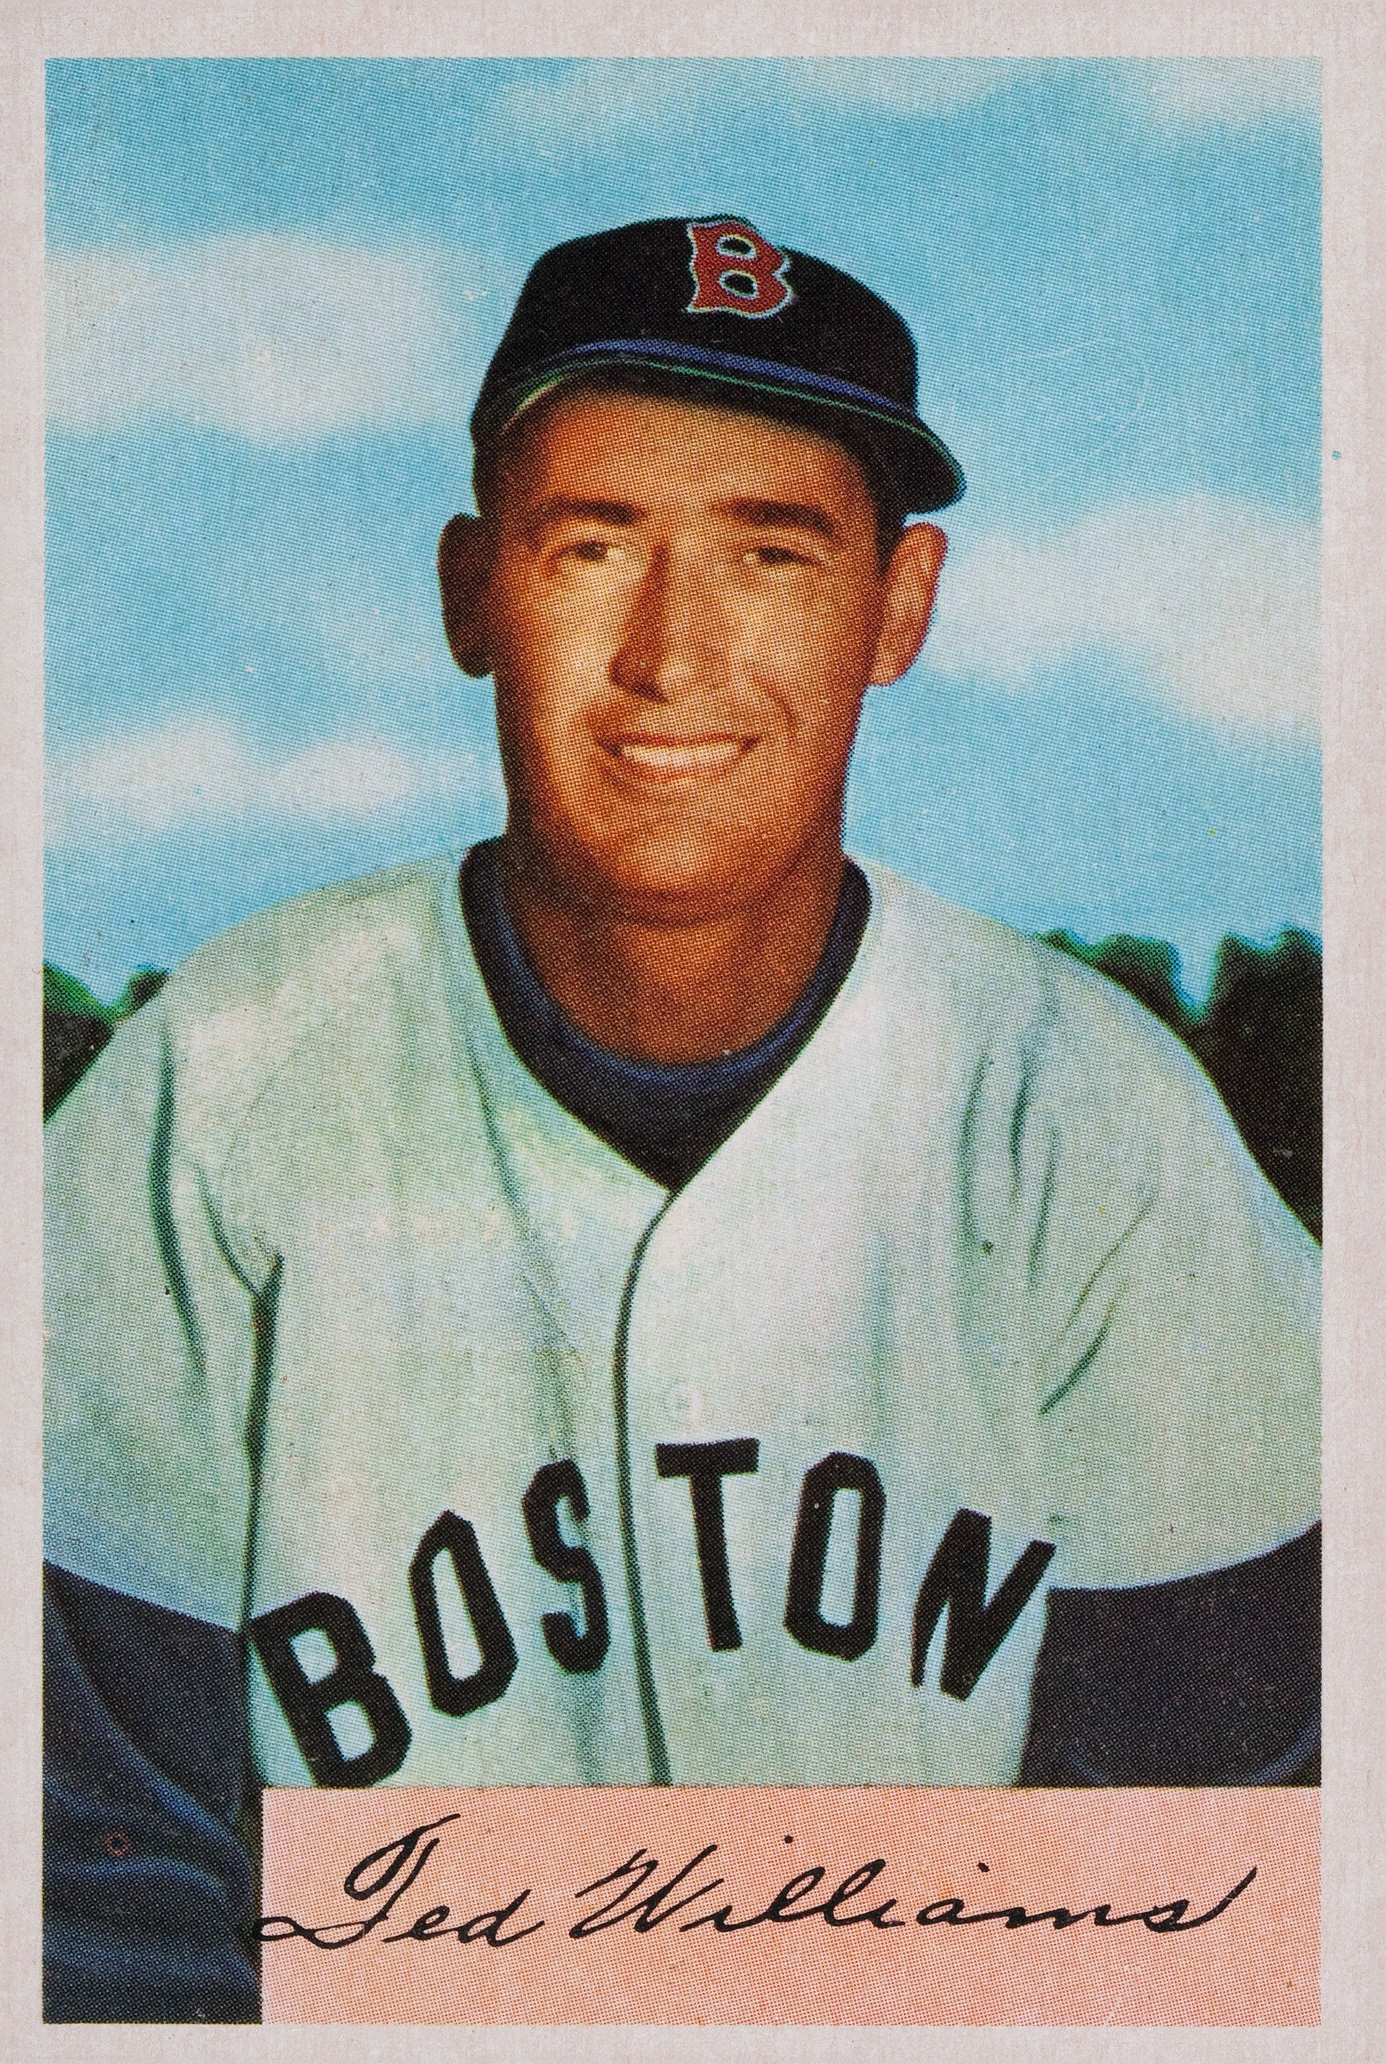
Ted Williams 1954
Bowman Gum, Public domain, via Wikimedia Commons |
| Rk | Player | OPS+ | BA | OBP | SLG | PA | AB | HR | AB/HR | From | To | Age |
| 1 | Ted Williams | 185 | .336 | .476 | .622 | 4,054 | 3,175 | 227 | 13.99 | 1950 | 1959 | 31-40 |
| 2 | Mickey Mantle | 173 | .311 | .425 | .569 | 5,410 | 4,478 | 280 | 15.99 | 1951 | 1959 | 19-27 |
| 3 | Stan Musial | 160 | .330 | .421 | .568 | 6,274 | 5,366 | 266 | 20.17 | 1950 | 1959 | 29-38 |
| 4 | Willie Mays | 158 | .317 | .391 | .590 | 4,633 | 4,074 | 250 | 16.30 | 1951 | 1959 | 20-28 |
| 5 | Eddie Mathews | 152 | .281 | .383 | .548 | 5,139 | 4,346 | 299 | 14.54 | 1952 | 1959 | 20-27 |
| 6 | Hank Aaron | 151 | .323 | .372 | .559 | 3,866 | 3,524 | 179 | 19.69 | 1954 | 1959 | 20-25 |
| 7 | Duke Snider | 147 | .308 | .390 | .569 | 6,010 | 5,219 | 326 | 16.01 | 1950 | 1959 | 23-32 |
| 8 | Ralph Kiner | 144 | .275 | .398 | .533 | 3,674 | 3,034 | 201 | 15.09 | 1950 | 1955 | 27-32 |
| 9 | Ernie Banks | 139 | .295 | .355 | .558 | 3,955 | 3,562 | 228 | 15.62 | 1953 | 1959 | 22-28 |
| 10 | Al Rosen | 139 | .287 | .386 | .500 | 4,309 | 3,667 | 192 | 19.10 | 1950 | 1956 | 26-32 |
| 11 | Larry Doby | 138 | .283 | .387 | .495 | 5,119 | 4,330 | 215 | 20.14 | 1950 | 1959 | 26-35 |
| 12 | Minnie Minoso | 137 | .306 | .400 | .476 | 5,869 | 4,979 | 145 | 34.34 | 1951 | 1959 | 25-33 |
| 13 | Jackie Robinson | 134 | .311 | .416 | .476 | 3,751 | 3,120 | 97 | 32.16 | 1950 | 1956 | 31-37 |
| 14 | Bob Nieman | 132 | .293 | .372 | .473 | 3,610 | 3,151 | 118 | 26.70 | 1951 | 1959 | 24-32 |
| 15 | Al Kaline | 131 | .311 | .374 | .489 | 3,777 | 3,368 | 125 | 26.94 | 1953 | 1959 | 18-24 |
| 16 | Yogi Berra | 130 | .287 | .356 | .490 | 5,818 | 5,214 | 256 | 20.37 | 1950 | 1959 | 25-34 |
| 17 | Ted Kluszewski | 130 | .302 | .361 | .518 | 5,016 | 4,565 | 239 | 19.10 | 1950 | 1959 | 25-34 |
| 18 | Gil Hodges | 128 | .281 | .369 | .514 | 6,163 | 5,313 | 310 | 17.14 | 1950 | 1959 | 26-35 |
| 19 | Vic Wertz | 128 | .277 | .370 | .487 | 4,477 | 3,847 | 195 | 19.73 | 1950 | 1959 | 25-34 |
| 20 | Gene Woodling | 126 | .286 | .388 | .438 | 4,714 | 3,980 | 110 | 36.18 | 1950 | 1959 | 27-36 |
| Rk | Player | OPS+ | BA | OBP | SLG | PA | AB | HR | AB/HR | From | To | Age |
| max | 185 | .336 | .476 | .622 | 6,274 | 5,366 | 326 | 36.18 | | | |
| min | 126 | .275 | .355 | .438 | 3,610 | 3,034 | 97 | 13.99 | | | |
| average | 143 | .300 | .390 | .524 | 4,782 | 4,116 | 213 | 20.97 | | |
More posts will follow for subsequent decades. Those who finished high in two decades:
Mantle: 2,1
Mays: 4,5
Aaron: 6,4
Dick Allen: 3,2
Schmidt: 7,1
Bonds: 1,1
BOLD: highest
Red: lowest; for AB/HR lowest is fewest AB to homer, the best
OPS+ On Base average Plus Slugging average adjusted for years and ballparks
100*[OBP/lg OBP + SLG/lg SLG - 1]
Adjusted to the player’s ballpark(s)
BA -- Batting Average: Hits/At Bats
For recent years, leaders need 3.1 PA
per team game played
OBP -- On Base "Percentage" (really average) (H + BB + HBP)/(At Bats + BB + HBP + SF) For recent years, leaders need 3.1 PA per team game played
SLG -- Slugging average: Total Bases/At Bats or
(1B + 2*2B + 3*3B + 4*HR)/AB
For recent years, leaders need 3.1 PA
per team game played
PA -- Plate Appearances
When available, we use actual plate appearances from play-by-play game accounts
Otherwise estimated using AB + BB + HBP + SF + SH,
which excludes catcher interferences.
AB -- At Bats; excludes Bases on Balls (walks)
HR -- Home Runs
OPS+ leaders for decades 1950s ... 2010s. Friday, February 12, 2021


No comments:
Post a Comment